Voice AI engineering
Instrument voice-agent latency as a trace, not a stopwatch
Trace voice-agent latency across capture, endpointing, transcription, model work, tools, synthesis, playback, and interruption recovery on live phone calls.
Voice latency event schema
A CSV event dictionary for timestamps, spans, attributes, derived metrics, privacy handling, and latency ownership.
voice-latency-event-schema.csv
The dashboard says “response latency: 1.4 seconds.” Which 1.4 seconds?
Was the caller still speaking? Did endpointing wait? Did the transcript churn? Did the model stall? Did a CRM call sit in another region? Did text-to-speech buffer a number? Did audio reach the phone late?
If you own voice reliability, one stopwatch gives you a complaint without a culprit. This tutorial shows how to build a call trace with spans, point events, and derived conversation metrics. The payoff is simple: when a caller says the agent felt slow, you can see where the time went.
Voice latency is a distributed-systems problem
A June 2026 r/AI_Agents post listed the chain builders end up debugging: media capture, transport, VAD, speech recognition, endpointing, model response, tool calls, synthesis, playback, and interruption handling. The thread is practitioner chatter rather than a benchmark, but the decomposition is sound. OpenAI’s account of delivering low-latency voice AI at scale likewise describes latency as a full-stack concern involving network paths, inference, audio streaming, caching, and service design. Your stack may use different providers, but the caller still experiences the sum.
Scroll diagram horizontally on smaller screens.
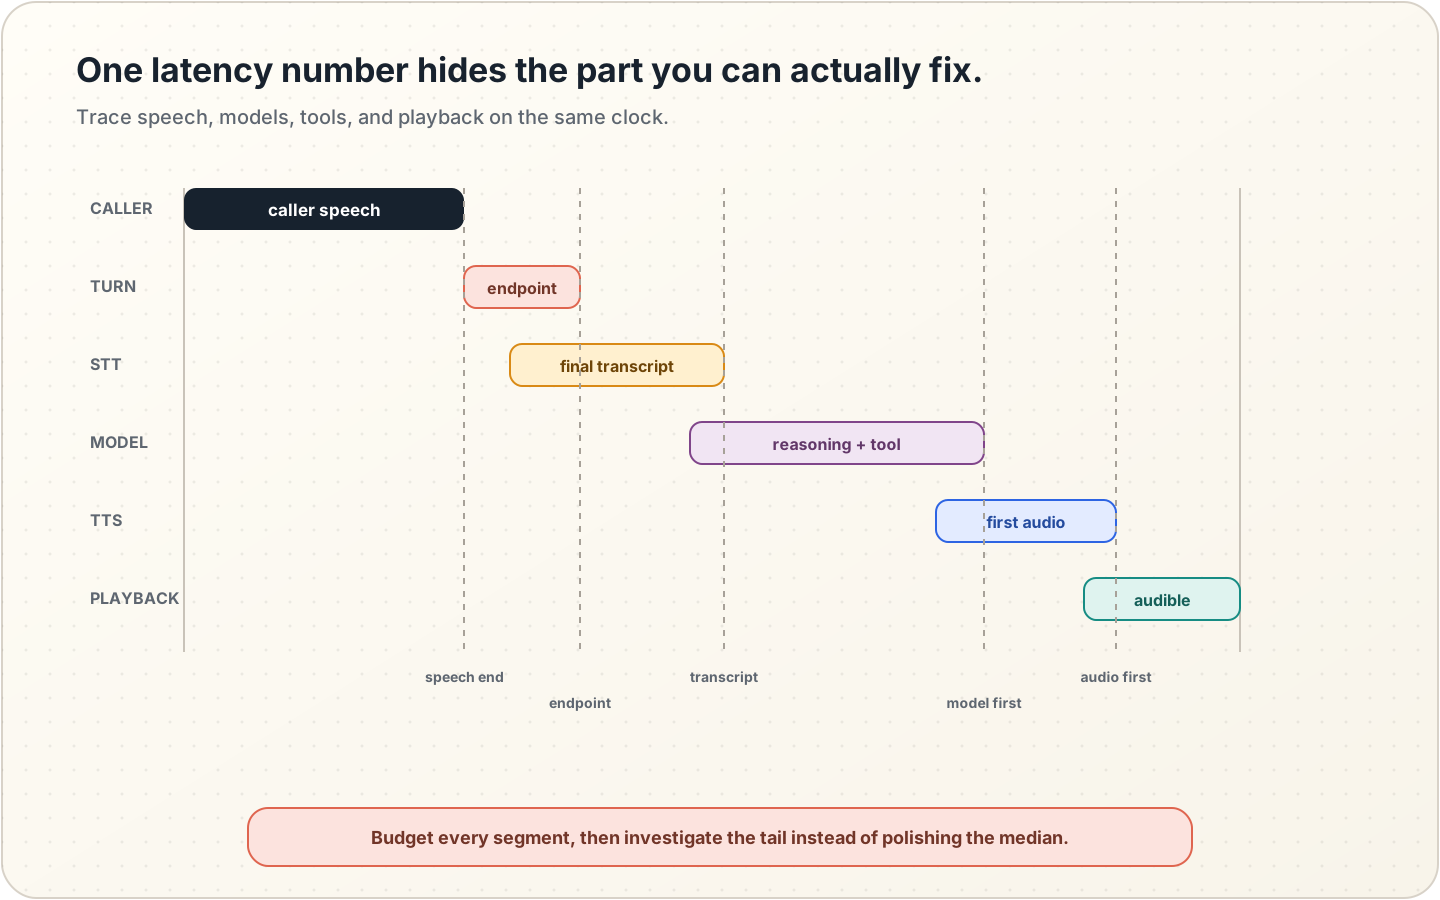
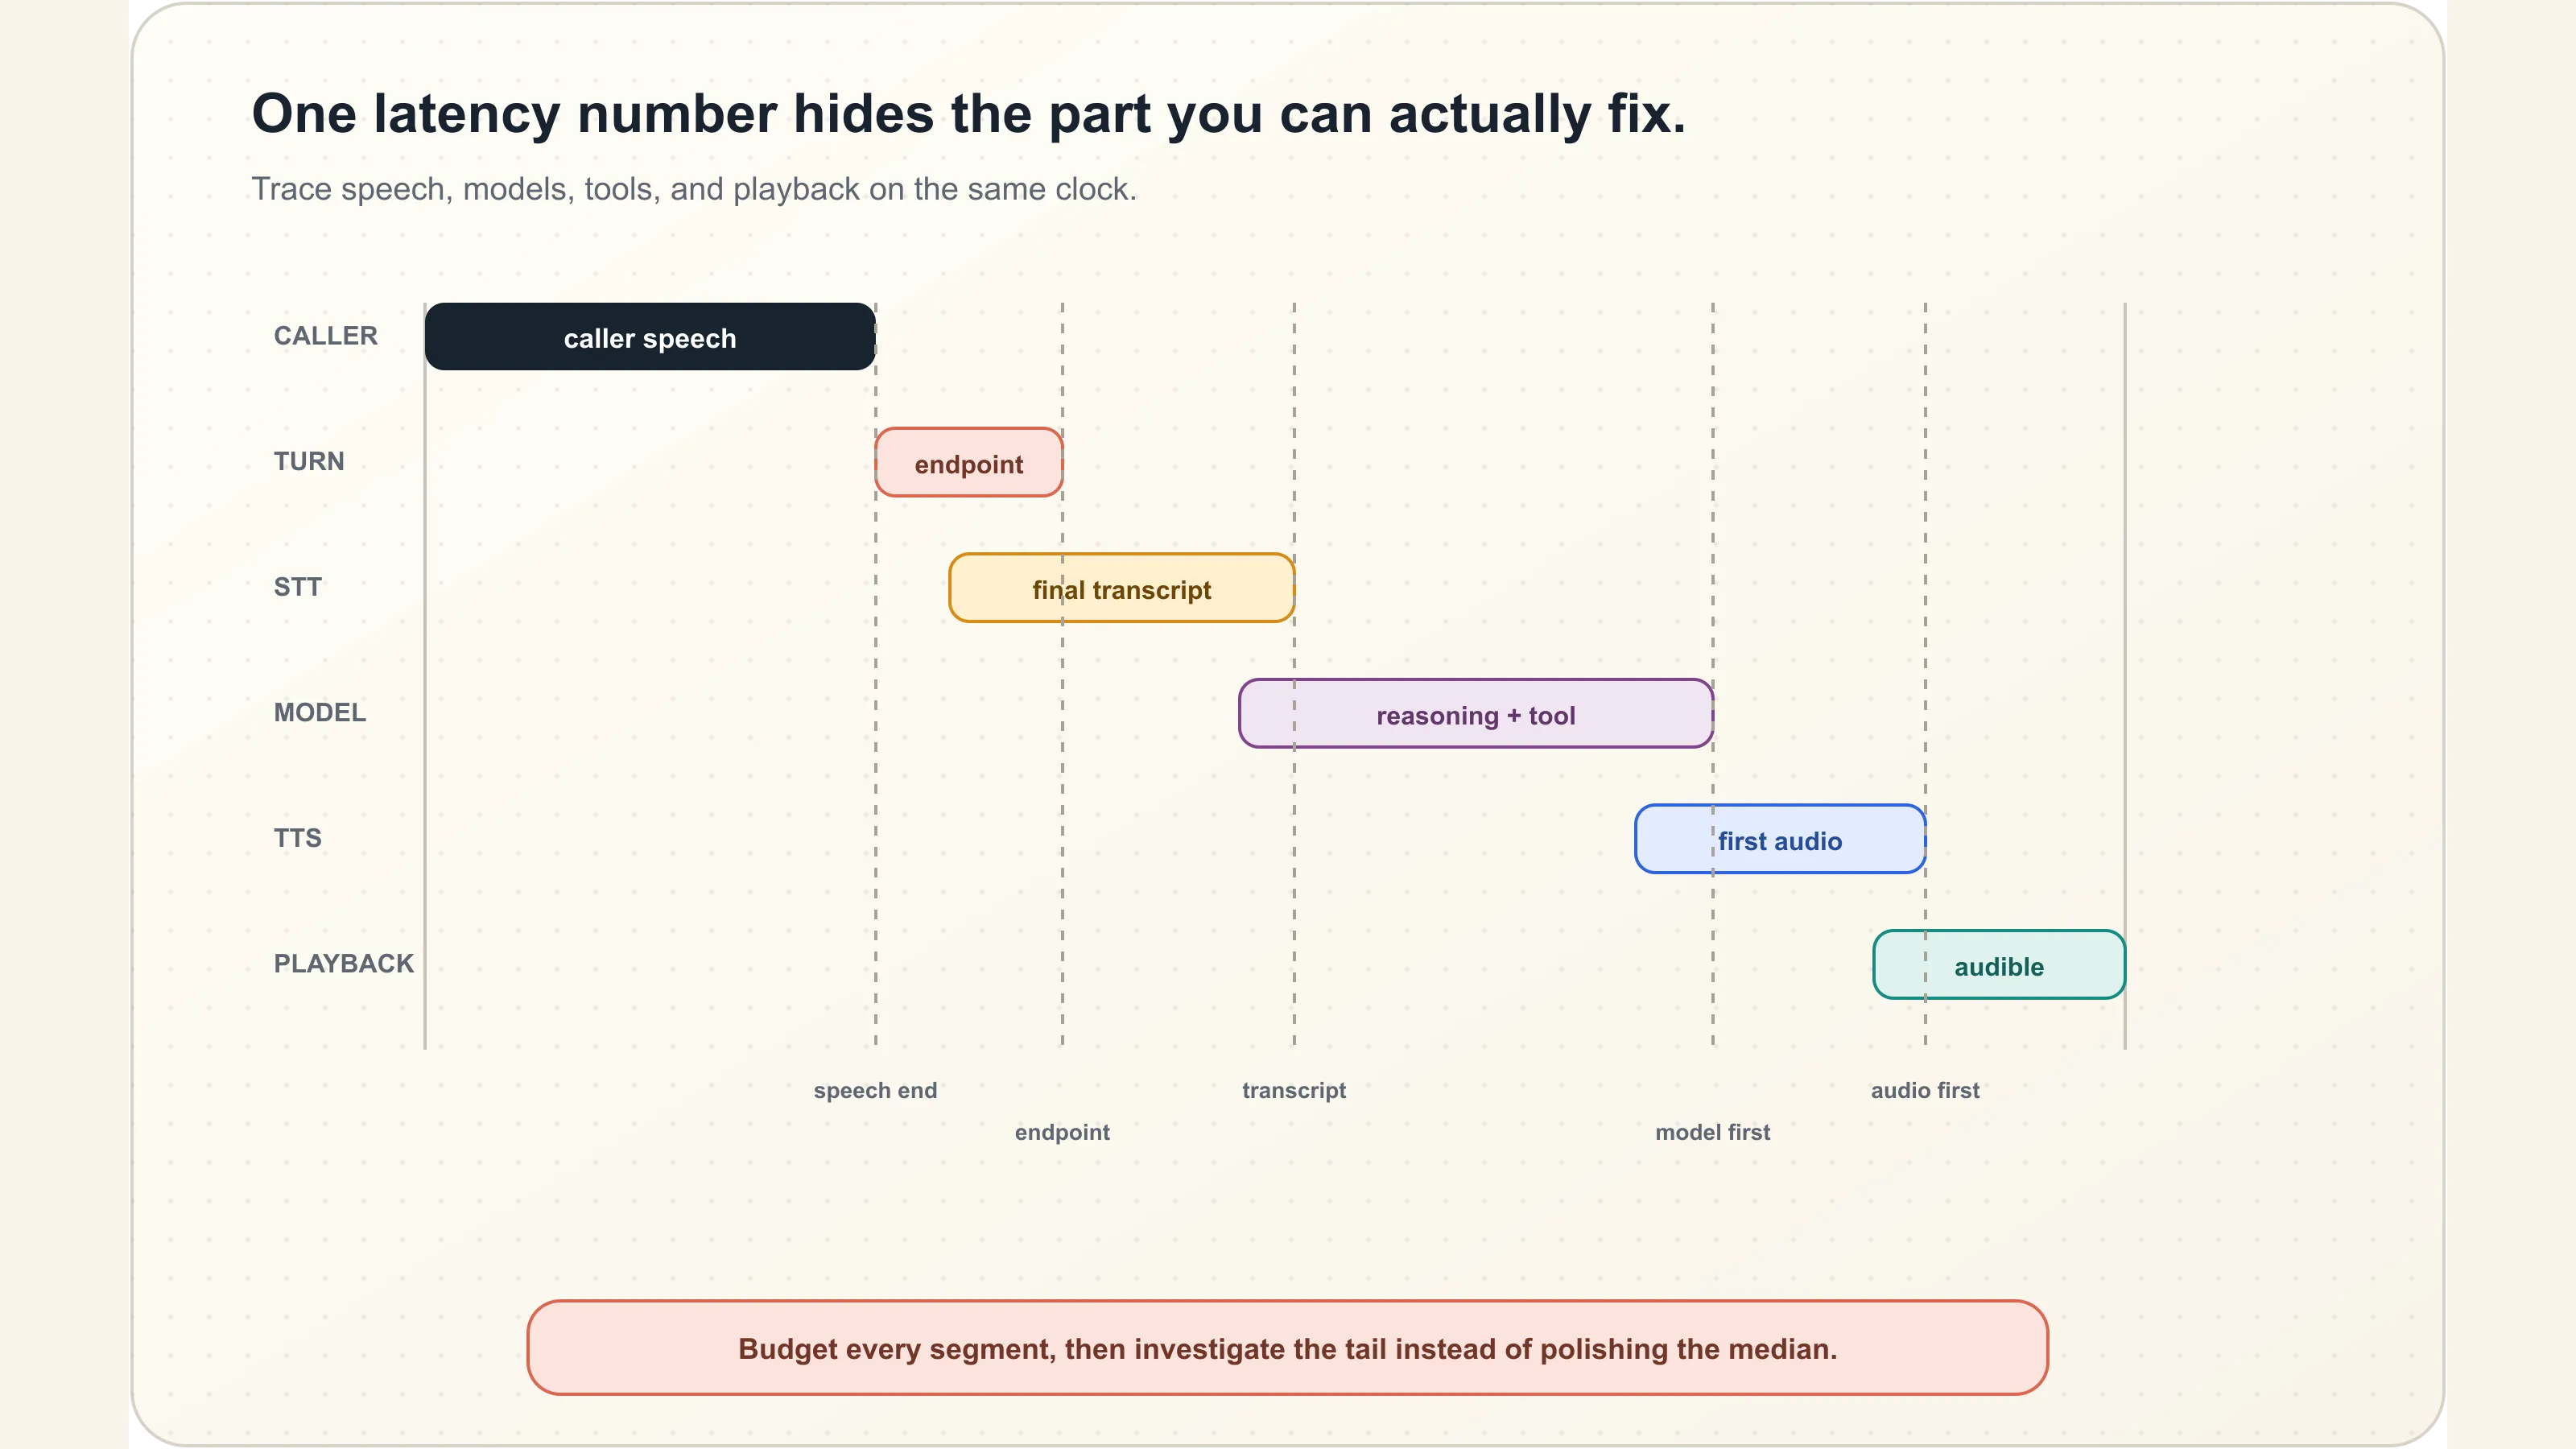
Pick one clock and one trace ID
Choosing one clock and one trace ID sounds boring, but it prevents hours of false debugging. Every event in one call needs:
- A stable
conversation_id. - A
turn_id. - A monotonic timestamp for local duration math.
- A wall-clock timestamp for cross-service correlation.
- Trace and span context propagated across your media, orchestration, model, and tool services.
Clock skew can make a child event appear before its parent. Prefer durations measured inside a service, then use trace correlation to join them. If separate machines must share absolute timing, monitor their clock synchronization.
Do not use phone number or raw account ID as the trace key. Keep identity in a controlled data system and pass a non-sensitive reference.
Propagate trace context through asynchronous boundaries, not only synchronous HTTP calls. Voice systems often cross WebSocket streams, message queues, provider webhooks, background tool workers, and SIP events. If a downstream service cannot carry the normal header, store an approved correlation token in its metadata and link the resulting span when the callback returns.
The call can outlive an individual process. A reconnect, transfer, or worker restart should create a new span under the same conversation trace rather than silently starting a second history. Record the relationship when the topology changes, especially during a warm transfer where caller, AI, and human media may briefly exist in separate rooms.
Test the trace itself with a synthetic call. Trigger a known tool delay, interruption, and handoff, then confirm that every event appears once, in a plausible order, with no sensitive value hiding in labels. Telemetry that is only inspected during an incident is usually incomplete when the incident arrives.
Spans for waits, events for moments
OpenTelemetry’s current event guidance draws a useful line:
| Type | Use it for | Voice examples |
|---|---|---|
| Span | An operation with a duration and a meaningful boundary | speech.input, endpointing.wait, stt.finalize, model.response, tool.lookup_customer, tts.first_chunk, audio.playback |
| Event | A state change or point-in-time occurrence with its own timestamp | speech.partial_received, speech.final_received, caller.barge_in_detected, playback.stopped, entity.corrected, tool.side_effect_committed, handoff.requested |
Keep names stable and put IDs or changing values in attributes rather than inside names. Use a versioned event dictionary, and define each timestamp from the component that can observe it. caller.speech_end should say whether it is the last received audio frame, the VAD estimate, or the endpointing decision. playback.started should mean audio reached your playback boundary, not merely that TTS returned bytes. Two teams can publish identically named events and still measure different intervals if that contract is missing.
Attach bounded attributes that explain the path: workflow, language lane, carrier route, codec, model family, tool name, result status, and whether the connection was warm. Avoid raw transcripts, phone numbers, account values, and unbounded prompt IDs. Put detailed evidence behind controlled references rather than turning the telemetry backend into another customer-data store.
The minimum timestamp set
Start with the minimum timestamp set for each caller turn:
| Event | Why it exists |
|---|---|
caller.speech_start |
Detect overlap and user wait |
caller.speech_end |
Anchor end-of-speech latency |
endpoint.detected |
Isolate endpointing delay |
stt.first_partial |
Observe early recognition |
stt.final |
Observe finalization and partial churn |
model.first_output |
Isolate model and orchestration wait |
tool.start / tool.end |
Isolate external dependency time |
tts.requested |
Measure orchestration gap before speech |
tts.first_audio |
Measure synthesis startup |
playback.started |
Isolate transport and buffering |
barge_in.detected |
Anchor interruption response |
playback.stopped |
Measure stop latency |
Add more only when somebody will query it because telemetry nobody owns becomes storage. For each required event, name the producing service, an owner, the maximum expected missing rate, and the query that uses it. Missing telemetry should be visible. If 20 percent of calls lack playback.started, the end-of-speech metric is not “fast”; it is incomplete.
Instrument the business path manually
Automatic instrumentation will catch HTTP, database, and framework work, but it will not know that a transcript became final or that the caller corrected an amount. OpenTelemetry’s JavaScript guide shows how to initialize the SDK and create application spans. A trimmed voice-oriented example looks like this:
import { SpanStatusCode, trace } from "@opentelemetry/api";

const tracer = trace.getTracer("voice-turn", "1.0.0");

export async function runTurn(turnId: string, run: () => Promise<void>) {
  return tracer.startActiveSpan("voice.turn", async (span) => {
    span.setAttribute("voice.turn.id", turnId);

    try {
      await run();
      span.setStatus({ code: SpanStatusCode.OK });
    } catch (error) {
      span.recordException(error as Error);
      span.setStatus({ code: SpanStatusCode.ERROR });
      throw error;
    } finally {
      span.end();
    }
  });
}
Use your SDK’s named event or log-event API for point occurrences. OpenTelemetry’s event semantic conventions are still marked as development, so pin your packages and record the schema version. Create spans around operations you can improve rather than every helper function. The useful boundary is where a caller-visible wait begins and ends: endpointing, final transcription, model inference, tool access, normalization, synthesis, transport, and playback. Internal child spans can help the owning team, but the shared call trace should stay readable enough for an incident review.
Errors need status and outcome separately. A tool span can return without a network error and still produce a business rejection. A timeout can occur after the remote side committed the write. Record transport status, application status, and any durable side-effect ID so the latency investigation does not mistake an uncertain mutation for a harmless slow read.
Derive metrics after collection
Do not emit every dashboard number from application code. Derive caller and component metrics from the trace so their definitions can evolve without changing every service.
End-of-speech to first audible response is playback.started - caller.speech_end. This is the silence a caller experiences after finishing a turn, so it should be the headline latency measure for the lane rather than time to first model token.
Endpointing wait is endpoint.detected - caller.speech_end. It isolates the time spent deciding that the caller has stopped and reveals whether an apparently slow model is actually waiting on a conservative speech boundary.
Model path is model.first_output - stt.final. Keep tool work outside this span unless the model cannot produce a useful first chunk before the tool responds, in which case the dependency should remain visible as a child span.
TTS startup is tts.first_audio - tts.requested, while delivery overhead is playback.started - tts.first_audio. Separating them prevents a slow telephony buffer from being blamed on the voice provider and makes regional transport problems easier to spot.
Barge-in stop time is playback.stopped - barge_in.detected. Measure the moment audio actually stopped, not when the application sent a cancellation request, because buffered speech can continue after the request succeeds.
Partial churn counts how often a recognized entity changes before finalization. A fast first partial that rewrites the account number five times can trigger bad speculative work, even when the final transcript and average latency look fine.
Report p50, p90, p95, and the slow-call count by workflow because the p95 booking call and the p95 FAQ call may have different owners. Keep distributions rather than only stored percentiles. During an incident, you may need to separate a bimodal tool path, compare carriers, or inspect calls above a new threshold. Histograms preserve that flexibility without precomputing every possible slice.
Define a conversational budget for each lane. A simple FAQ might spend most of its time on endpointing and synthesis. A booking turn may reserve more time for an authoritative lookup. The overall budget stays tied to the caller experience, while the component allocations make trade-offs explicit. When one component improves, do not quietly let another consume the saved time.
Slice by the condition that causes the wait
Group traces by route and media conditions such as telephony route, edge region, and codec; by workload such as language, voice, workflow, tool path, model, and prompt version; and by call state such as warm or cold connection and whether an interruption occurred. Include audio condition only where it was lawfully captured and labeled. Use bounded categories and protected evidence links rather than high-cardinality labels that dump raw user values into telemetry.
Start every slow-call review from a caller-visible symptom. Was there silence after the caller stopped, a pause halfway through the agent response, late audio after an interruption, or a long wait during transfer? Each symptom maps to a different interval. This prevents a team from optimizing model first-token time while the caller is waiting on endpointing or phone delivery.
Compare slow traces with nearby normal traces from the same workflow and condition. The difference often reveals a cold connection, a specific tool branch, a particular codec, or a retry that a global percentile conceals. Keep deploy and configuration markers on the timeline so an operator can see whether the tail changed after a model, carrier, prompt, or tool release.
A fictional trace that points to the wrong team
Consider a fictional pharmacy refill agent. The call feels slow after the customer names a medicine, and the team blames the model because the first audible response arrives 1.7 seconds after the caller stops. The scenario and timings are invented, but they show how a real trace changes the diagnosis:
| Component | Duration |
|---|---|
| Endpointing | 230 ms |
| STT finalization | 140 ms |
| Model first output | 190 ms |
| Formulary tool | 930 ms |
| TTS startup | 120 ms |
| Playback delivery | 90 ms |
The durations add up to 1.7 seconds, and the formulary tool owns most of the silence. The product team can speed up the lookup, cache safe data, issue an honest acknowledgement during the call while the lookup runs, or redesign the turn.
The acknowledgement itself needs evaluation. It should be truthful, short, and used only when the wait warrants it. Saying “I have updated that” before the tool finishes is not a latency technique; it is a false outcome claim. For longer operations, consider whether the workflow can gather another needed fact, offer a callback, or move to a human instead of filling silence.
Do not win the metric and lose the call
Time to first audio can be gamed with “Sure” followed by three seconds of nothing. Track first useful audio, tool-complete truth, and final outcome beside the timing trace because an agent that speaks before a write finishes is wrong with low latency. Voxeval joins the trace with conversation evaluation so latency gets credit only when the turn state and business outcome remain correct.
Use trace exemplars in release review. Select representative fast calls, tail calls, interrupted turns, tool failures, and route changes. Averages show whether the candidate moved; exemplars show why. If the new release improves first audio by speaking before a value is validated, the joined outcome check should make that regression visible.
Set alerts on changes that have an operator and a response. A p95 increase in tool.lookup_customer may page the service owner. A gradual rise in endpointing wait for one language lane may create an investigation ticket. An alert that says only “voice latency high” will bounce between teams until the caller stops complaining.
Use the same trace to diagnose streaming text-normalization delays and post-interruption recovery. Both can look like “the model was slow” until the spans separate the wait. The voice latency event schema lists starter spans, events, attributes, privacy notes, derived metrics, and likely owners to map to your stack.
Start with one complete trace, one slow call, and one owner. Once the team can explain that call end to end, scale the schema across the rest of the product. For more production voice AI instrumentation and evaluation guides, subscribe to Voxeval.
Reference list